Home | Resolution | Monitor Calibration
Standard Pattern Specifications
SMPTE Bars 
SMPTE Bars are split field bars composed of standard EIA 75% amplitude
white bars for the top 2/3 of the field, reverse blue bars for the next
1/12 of the field, and the IYQB or „PLUGEš signal for the remainder of
the field. This split-field arrangement allows adjustment of color saturation
or color intensity and hue or tint on a color monitor that has the feature
to allow the blue gun only. The monitor is set to blue only and the hue
or phase is adjusted on the monitor until there is no discernable intensity
difference between the reversed blue bars and their adjacent color bars.
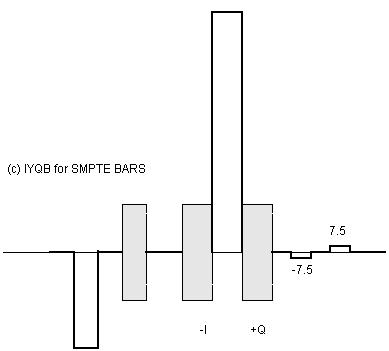
The IYQB section of the bottom pattern consists of a 7.5 IRE (black level)
pedestal with a 40 IRE „-Iš phase modulation, a 100 IRE white pulse, a
7.5 IRE (black level) pedestal with a 40 IRE „+Qš phase modulation, and
a 7.5 IRE pedestal with 3.5 IRE, 7.5 IRE, and 11.5 IRE pedestals. -I and
+Q phase modulation signals are helpful to assure the subcarrier processing
in correct. PLUGE stands for (Picture Line-Up Generating Equipment). This
pattern, at the bottom and to the right side of the SMPTE bars is used
to set the brightness of the monitor. The monitor is adjusted so that the
black and blacker than black areas are indistinquishable from each other
and the lighter than black area is slightly lighter (the contrast should
be at the normal setting). 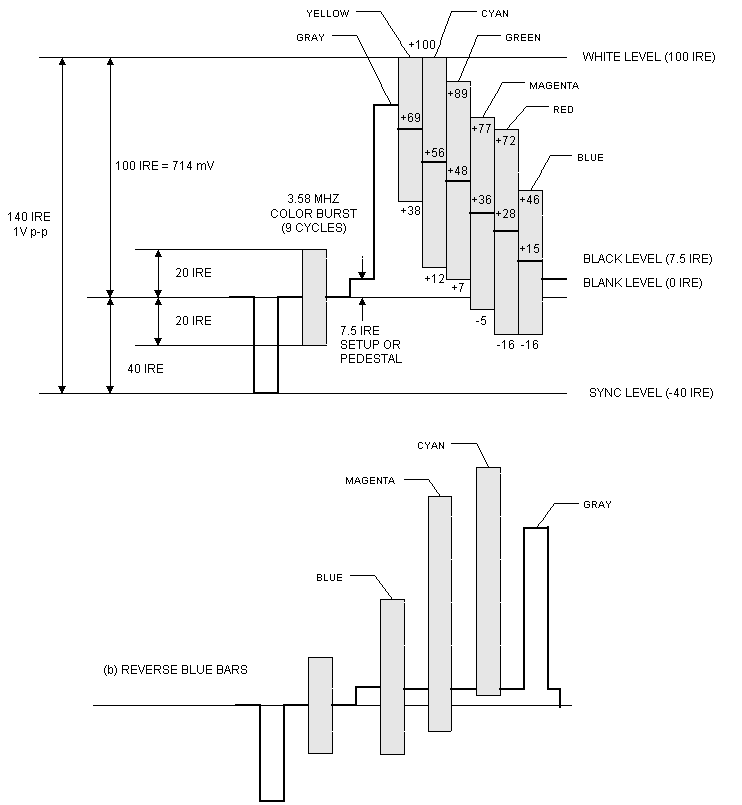
100% White Full Field Bars
The 100% white full field bars are the same as the EIA color bars ,
except a 100 IRE white level is used. This test signal is helpful to check
chroma amplitude versus overall video level. If the system under test is
setup properly for chroma gain the tips of the yellow and cyan bars should
be at 100% level matching the white bar peak amplitude. 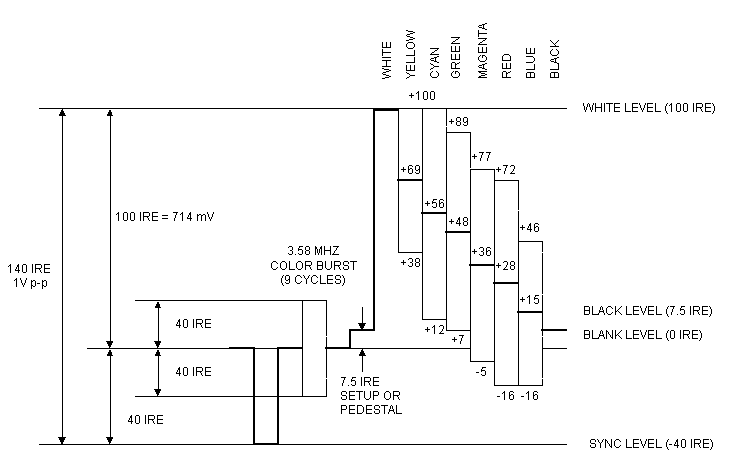
White EIA Full Field Bars
The EIA color bars are a part of the EIA-189-A standard. The seven bars
(gray, yellow, cyan, green, magenta, red, and blue) are at 75% amplitude,100%
saturation. Each color bar uses 1/7 of the image area. 3.1.4. Window The
window pattern consists of a white rectangular area in the middle of the
screen surrounded by black. This pattern is good for testing low frequency
response and video tilt as well as the performance of video clamping in
the video processing system. 3.1.5. Red, Green, Blue and Black Full Field
These patterns are full image screens of red, green, or blue. These are
helpfull in television monitor testing to see if there are any purity problems.
If there are problems, you would see off color areas rather than full saturated
vivid colors throughout the screen. 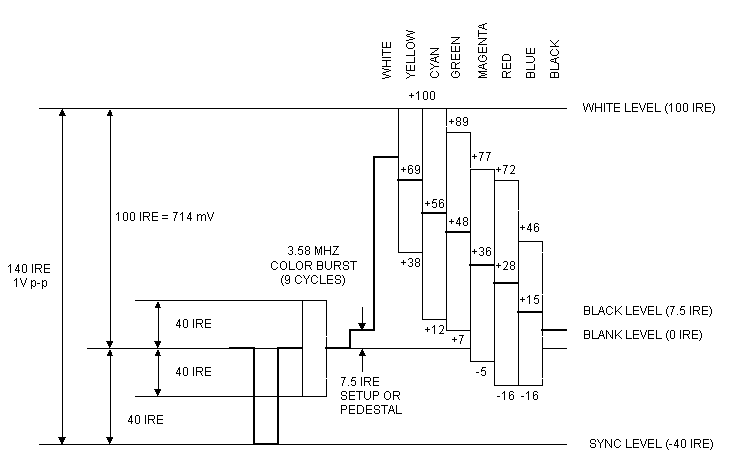
Window 
This pattern is great for checking the low frequency response of the video system. The signal is best looked at on a oscilloscope at the output of the video system. Be sure that the window waveform is flat across the oscilloscope display at both the horizontal or vertical sweep rates.
Red, Green, Blue and Black Full Field 


These full raster field colors are great for monitor purity verification and adjustments. If you see the color saturation or hue vary across the screen the purity needs adjustment.
Enhanced Patterns
Multiburst
The multiburst signal is great for quick measurment of the frequency response of the system. The signal typically includes six packets of discrete frequencies which fall withing the TV passband. The packet frequencies usually range from 0.5 Mhz to 4.1 or 4.2 Mhz, with frequency increasing toward the right side of each line.
Cable Sweep
Cable Sweep is another frequency response measurement signal. Rather than discrete packets as in multiburst this signal has a continous sweep of frequencies from 1 to 4.5 Mhz. There are frequency markers on lines toward the bottom of the screen. These are helpful to determine where your rolloff occurs.
NTC 7 Combination
The NTC (U. S. Network Transmission Committee) developed a combination test signal that may be used to test several NTSC video parameters, rather than using multiple test test signals. This test signal is cleaverly called the NTC-7 Combination Test Signal and consists of a white flag, a multiburst, and a modulated pedestal signal. The white flag has a peak amplitude of 100 IRE and a width of 4 us. The multiburst has a 50 IRE pedestal with peak-to-peak amplitudes of 50 IRE. The starting point of each frequency packet is at zero phase. The width of the 0.5 Mhz packet is 5 us; the width of the remaining packets is 3 us. The 3-step modulated pedestal is composed of a 50 IRE luminance pedestal with three amplitudes of modulated chrominance (20, 40, and 80 IRE peak-to-peak). The rise and fall times of each modulation packet envelope are 400 ns.
Stair Case, 5 Step
The 5-step staircase signal, shown in the figure below, consists of
5 luminance steps. The peak-to-peak modulated chrominance is 40 IRE. The
modulated chromaninance has a phase of 0 relative to burst. Note a 0 IRE
setup is used.. This test signal can be used for measuring non-linear luminance
variations in a system. 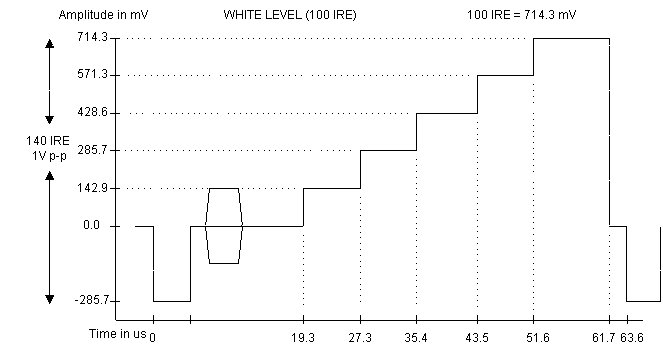
Modulated Ramp 
The modulated ramp test signal is composed of a luminance ramp from 0 IRE to either 80 or 100 IRE. The 80 IRE ramp provides testing of the normal operating range of the system; a 100 IRE ramp may be used to optionally test the entire operating range The peak-to-peak modulated chrominance is 40 IRE. The modulated chromaninance has a phase of 0 relative to burst. Note a 0 IRE setup is used. The rise and fall times at the start and end of the envelope is 400 ns. This test signal is can also be used to measure differential gain and is good for measuring analog to digital bit errors in digital video systems.
Cross Hatch with Dots 
This pattern generates a matix of horizontal and vertical lines helpfull for adjusting monitor convergence. Since a white line on the screen is made up of red, green and blue components, each picture tube electron gun must have their respective beams aligned perfectly overlayed on each other or you get hallows around the misaligned image areas.
Center Cross with Safe Area 
This signal is simalar to the Cross Hatch but is used to define the safe image. Your video production should not contain any picture information outside of the safe area or your viewers may not see it. The televison monitor should show the entire safe area or it needs adjustment.
Bounce  alternating patterns each second
This test signal is great to test the low frequency and clamp response of the system. The video signal will vary from 0 IRE to 100 IRE at a 1 second rate. The video signal should not distort or clip under either condition and maintain a constant sync tip level if the clamp circuitry is functioning properly. The television monitor should not change brightness or width with the widely varying average picture level of the bounce signal.
Test Signal Matrix
The Matrix pattern is a combination of the patterns we have discussed previously. There are approximately 48 lines of each test pattern to make one image comprised of 5 different patterns. The 5 patterns that make up the matrix are, Color Bars, Red, Green, Blue and 50 IRE flat signal.